The following provides existing and future roadway information for the US 2 study corridor, including traffic data and analyses results. More detailed information on how traffic data was collected, traffic forecasts developed, and analyses conducted is provided in the West Plains Subarea Transportation Management Plan, Phase 1, US 2 Vicinity Executive Summary Document (PDF 26 MB).
Roadway System Characteristics
The US 2 study corridor is a four-lane principal arterial with a two-way center left turn lane. Twenty intersections were included in the analysis of the study, of which 18 had traffic counts taken and future traffic forecasts developed. The interactive map tool below contains information about the existing and future study area roadway system and intersections that can be turned on/off such as functional classification, posted speed limit, and intersection control type.
Existing Traffic Counts
Traffic count data were collected during January, February, and May of 2019 for the AM and PM peak periods using Miovison cameras provided through collaboration of study partners to capture turning movement counts at key intersections. The AM and PM peak hours along the corridor were determined from the traffic counts to be:
- AM Peak Hour: 7:00 am to 8:00 am
- PM Peak Hour: 4:15 pm to 5:15 pm
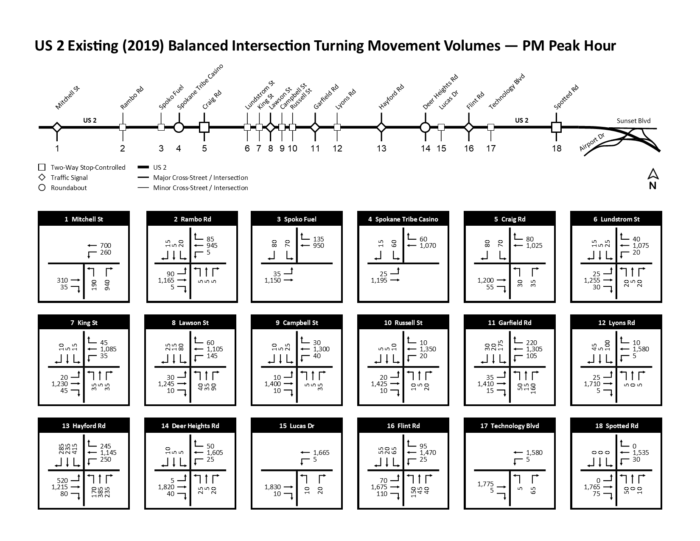
Collected AM and PM peak hour traffic counts were balanced between intersections and operations analyzed to serve as a baseline for future 2040 conditions. Balanced 2019 AM and PM peak hour turning movement volumes are shown in the figures below. Select an image to download a full-size PDF of the AM (313 KB) and PM (312 KB) figures.

Future Traffic Forecasts
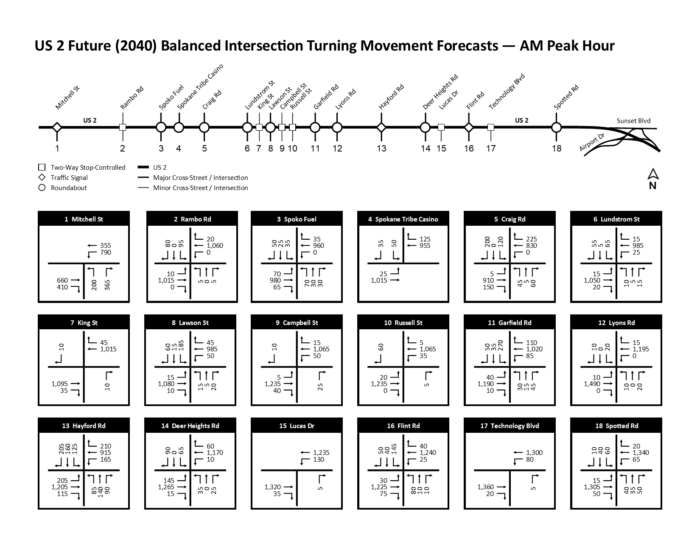
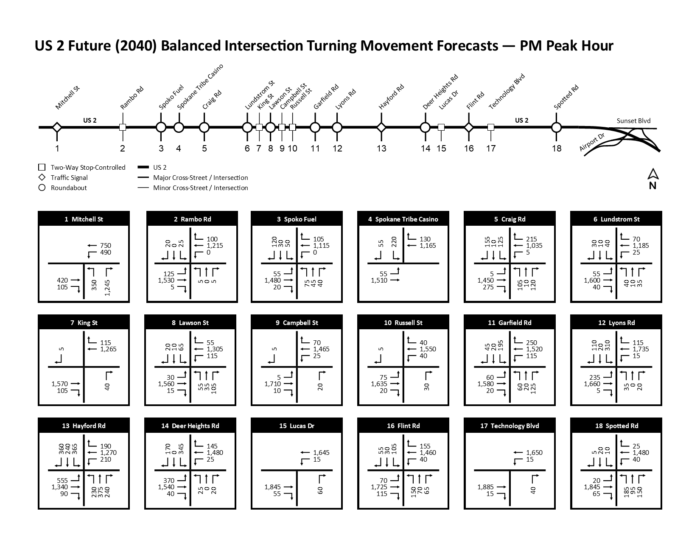
Projected land use growth for the study area (see the Land Use page for more information) was used within the Spokane Regional Transportation Council (SRTC) travel demand model to estimate the growth in traffic through the year 2040. This growth was applied to the 2019 traffic volumes shared above to develop traffic forecasts, which are used to identify future deficiencies and analyze how future improvements will impact traffic flows. Balanced 2040 AM and PM peak hour turning movement forecasts are shown in the figures below. The traffic volumes are considered planning-level and can be easily used for upcoming planned projects for the design phase. Select an image to download a full-size PDF of the AM (312 KB) and PM (311 KB) figures.
Estimated Changes in Travel Times
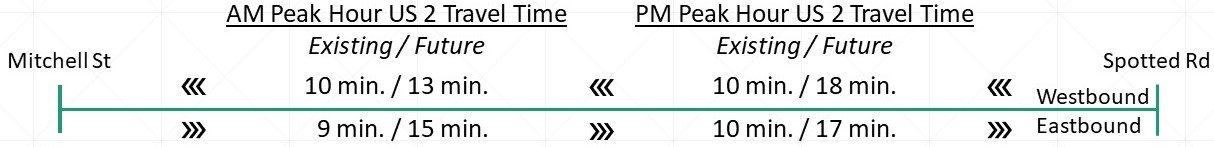
Travel time (the amount of time it takes to travel from one end of the study corridor to the other, in each direction) was used in the study as an indicator to compare existing and future operations along the US 2 study corridor and to understand how competitive parallel routes might be. The existing (year 2021) average travel times were determined by driving the corridor, multiple times, during the AM and PM peak hours using FHWA’s random floating car method. Future traffic forecasts were analyzed using the operational analysis software SIDRA, which provided estimated travel times for the corridor in 2040.
As shown in the figure below, 2040 travel times are projected to increase in the AM peak hour from 10 minutes today to 13 minutes for westbound traffic and 9 minutes today to 15 minutes for eastbound traffic. In the PM peak hour, travel times are projected to increase from 10 minutes for both directions today to 18 minutes for westbound traffic and 17 minutes for eastbound traffic. The future 2040 estimated travel times can be reduced by developing and implementing the strategies identified on the Final Outcomes / Practical Solutions page.
US 2 Forecasted Oversaturation
Analysis of the future traffic forecasts in SIDRA along the US 2 corridor concluded that the corridor would not have the capacity to accommodate the forecasted demand in year 2040 during the AM and PM peak hours. The strategies identified on the Final Outcomes / Practical Solutions page were reviewed with WSDOT subject matter experts (SMEs) representing the categories in the table below to determine if implementing the strategies would accommodate these “oversaturation” trips via other travel decisions, such as walking and biking instead of driving. Through reviewing studies and local travel data, a range of trips that could be diverted via each strategy category was developed and is displayed in the table below.
US 2 Trip Diversion Potential by Multimodal Strategy
| Multimodal Strategies Category | Peak Hour Trip Diversion Range (trips per peak hour) |
|---|---|
| Active Transportation (Includes walking, biking, and emerging modes such as e-bikes and electric scooters.) | 5 – 30 |
| Public Transit | 5 – 20 |
| Commute Trip Reduction (CTR) / Travel Demand Management (TDM) | 275 – 1,920 |
| Traffic Operations / Intelligent Transportation System (ITS) | 115 – 360 |
| Freight (divert to 18th/21st Ave) | 10 – 30 |
| Total Potential Diversion Range | 410 – 2,355 |
| Targeted Diversion Range | 150 – 450 |
Crash Analysis
An engineering crash analysis was conducted for the US 2 study corridor to assess its safety performance. The most current five years, at the time of the study, of WSDOT crash data (2015 to 2019) for US 2 between Mitchell Street/Fairchild Air Force Base and the US 2/I-90 interchange were used. The data contained a total of 543 crashes, which is broken down by crash severity in the table below.
Study Corridor Number of Crashes by Severity (2015-2019)
| Crash Severity | Number of Crashes |
|---|---|
| Fatal Crashes | 4 |
| Suspected Serious Injury Crashes | 8 |
| Suspected Minor Injury Crashes | 40 |
| Possible Injury Crashes | 116 |
| Property Damage Only Crashes | 375 |
| Total Crashes | 543 |
The findings of the analysis were broken into two parts: all fatal and serious injury crashes and all crashes involving bicyclists and/or pedestrians.
Fatal and Serious Injury Crashes
Over the five-year period, there were four (4) fatal and eight (8) suspected serious injury motor vehicle involved crashes. Driver or pedestrian behavior was a contributing factor in nine (9) of these crashes. Five (5) of the crashes were intersection-related and occurred at the following locations along US 2:
- Rambo Road
- Craig Road
- Hayford Road
- Flint Road
- east of West Sunset Frontage Road
The remaining seven (7) fatal or serious injury non-intersection crashes were mainly isolated crashes. However, two of these crashes occurred between Campus Drive and Spotted Road (one fatal crash and one suspected serious injury crash) where a vehicle that was going straight hit a pedestrian that was crossing at a non-crosswalk location.
Two projects along the corridor are expected to mitigate the likelihood of opposite direction mid-block crashes:
- US 2/Craig Road channelization, which restricts left turns from US 2 to Craig Road and through movements from Craig Rd across US 2, and
- Channelization along US 2 between Hayford Road and Hazelwood Rd with a pedestrian crossing refuge at Hazelwood Rd.
Additionally, the new roundabout at US 2/Deer Heights helps reduce vehicular travel speeds along US 2 and provides crosswalks and median refuges to help facilitate crossing at locations with lower operating speeds through the intersection for bicyclist and pedestrians.
Bicycle/Pedestrian Involved Crashes
Over the five-year period, bicycles/pedestrians were involved in three (3) fatal, two (2) serious injury, six (6) minor injury, one (1) possible injury, and one (1) property damage only crashes. There were no bicycle/pedestrian-involved fatal or serious injury crashes at intersections on the corridor. As noted previously, one fatal crash and one suspected serious injury crash both occurred between Campus Drive and Spotted Road, with both involving a vehicle going straight and hitting a pedestrian crossing US 2 at a non-crosswalk mid-block location. All bicycle/pedestrian-involved fatal and serious injury crashes had bicyclist/pedestrian behavior as a contributing factor and in one crash the driver was under the influence of alcohol.
The new channelization along US 2 between Hayford Road and Hazelwood Road with a pedestrian crossing refuge at Hazelwood Road is anticipated to reduce the likelihood of mid-block crashes with pedestrians near the location.