Environmental planning is the process of collaboratively facilitating decision making to carry out land development with the consideration given to the natural environment, social, political, economic and governance factors and provides a holistic framework to achieve sustainable outcomes. A major goal of environmental planning is to create sustainable communities, which aim to conserve and protect undeveloped land.
Environmental Assessment
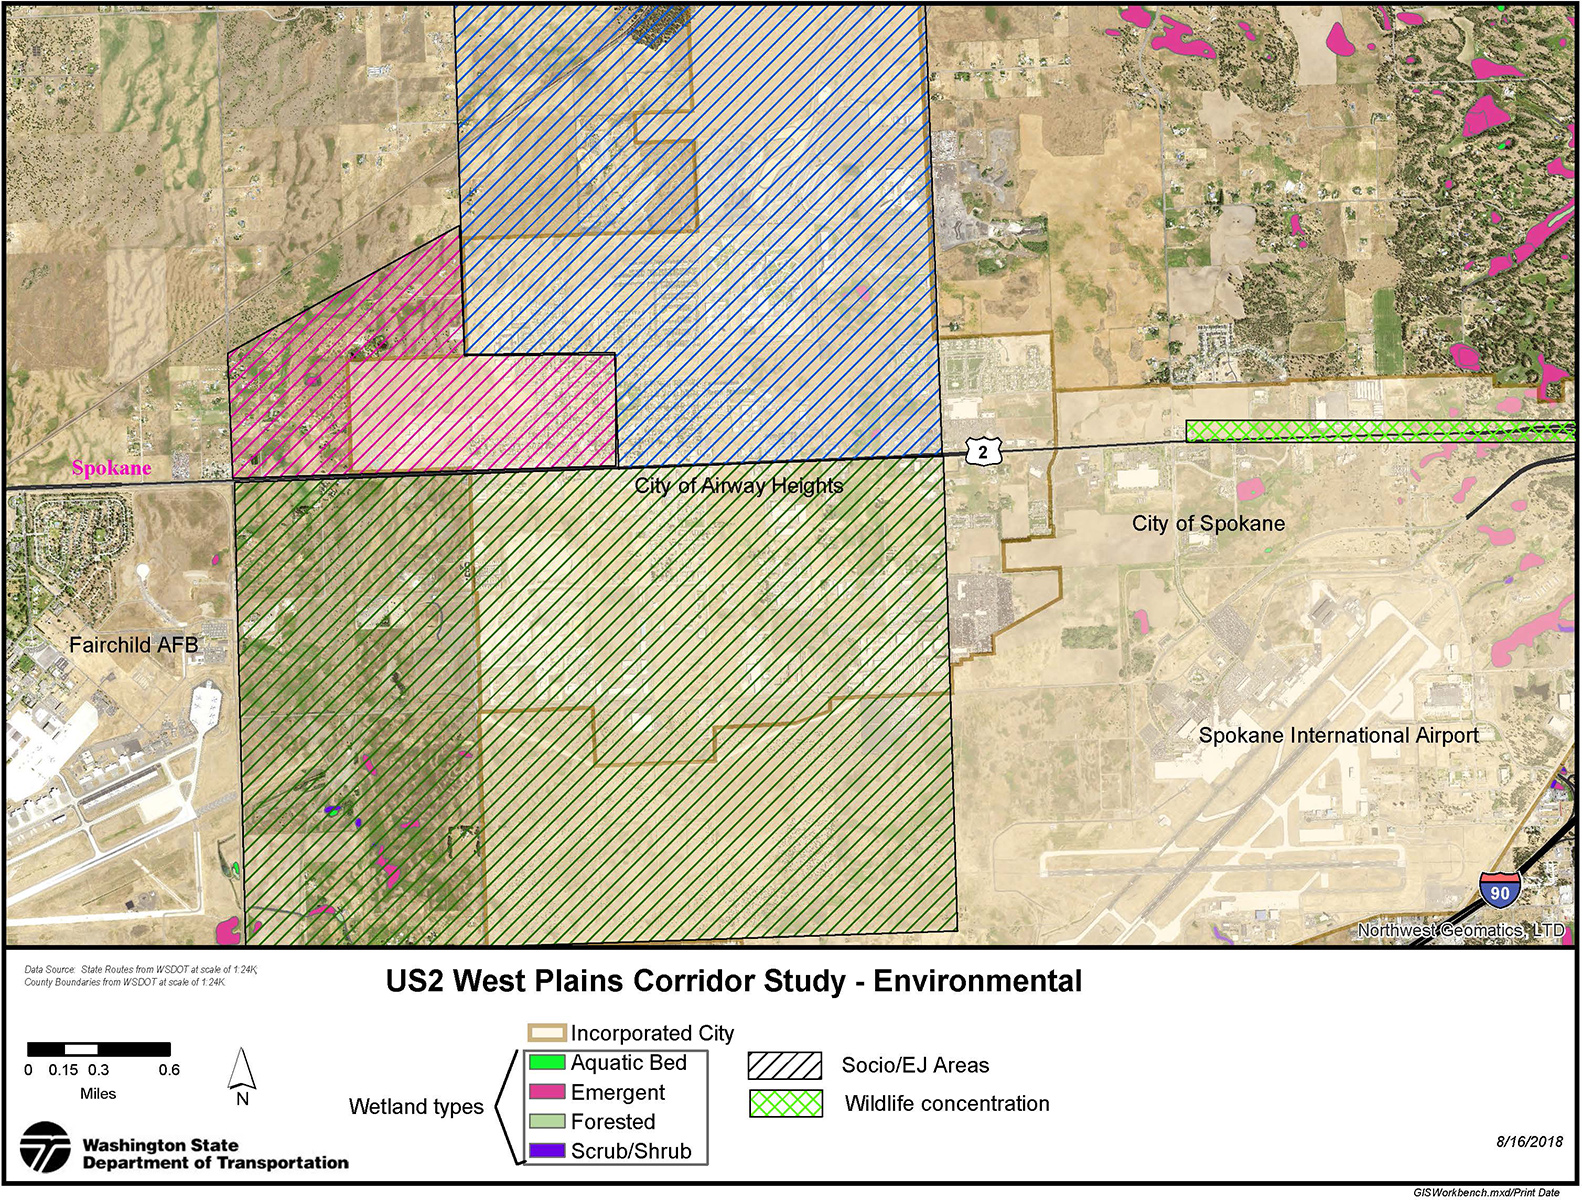
The US 2 West Plains Environmental Report 2018 (PDF 54KB) completed in 2018 by both the WSDOT Eastern Region Environmental and Headquarters Environmental divisions provides an environmental assessment of the study area. The environmental assessment identified there were no chronic environmental deficiencies and rated the climate vulnerability as low. Two fish barriers on US 2, as well as two fish passage barriers and a non-fish crossing on I-90, were identified. There was an apparent high occurrence of moose-vehicle collisions, between Russell Road and John A. Finch Arboretum areas, that suggested a need for a wildlife crossing. The map below summarizes several environmental factors considered and documented by the assessment.
Environmental Justice
The environmental assessment conducted a cursory review of socio-economic data and determined an environmental justice (EJ) assessment might be needed. A subsequent EJ assessment was completed using US Census Bureau American Community Survey data from 2012-2016 to determine the socio-demographic profile of the study area, which is summarized in the tables below. The findings of the EJ assessment informed the public engagement design for the project.
Study Area Population Statistics
| Metric | Value |
|---|---|
| Total Population | 13,550 |
| Study Area Population Density | 371/sq. mi. |
| Highest Population Density* | 1,365/sq. mi. |
Study Area Socio-Economic Summary
| Population Group | % of Total Population* (study area / high) |
|---|---|
| 65+ years of age | 9.7% / 24% |
| Below Poverty | 11% / 24% |
| Minority Population | 25.6% / 39% |
| … Hispanic Non-White | 7.4% / 13.7% |
| … African American | 4.9% / 16% |
| … American Indian | 2.5% / 19% |
| … Asian | 2.7% / 6% |
| … Hawaiian Native | 0.3% / 1% |
| … Other Race | 2.1% / 6% |
| … 2+ Races | 5.7% / 13% |
| Veteran | 11.5% / 33% |